Introduction to Java Virtual Machine
Note: This article has been updated for Java 8 and later. The original 2015 version described the Permanent Generation (PermGen), which Java 8 removed and replaced with Metaspace (JEP 122); the garbage-collection section has also been rewritten to cover the modern HotSpot collectors (G1, ZGC, Shenandoah). The behaviors described here are those of HotSpot; other JVM implementations may differ.
What is JVM?
The Java Virtual Machine is the cornerstone of the Java platform. It is the component responsible for Java’s hardware and operating-system independence, the small size of its compiled code, and its ability to protect users from malicious programs.
The Java Virtual Machine is an abstract computing machine. Like a real machine, it has an instruction set and manipulates various memory areas at run time. The JVM does not understand Java source code; that is why you compile your .java files into .class files containing the bytecode the JVM can execute.
The JVM controls the execution of every Java program. It enables features such as automated exception handling and a garbage-collected heap.
JVM Architecture
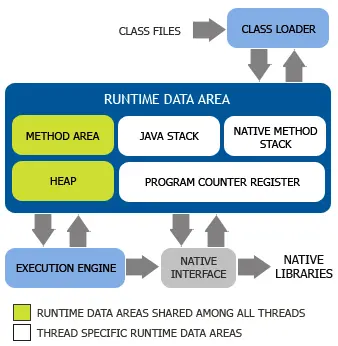
At a high level the JVM is made up of three subsystems that work together: the class loader subsystem, the run-time data areas (its memory), and the execution engine.
- Class Loader: loads, links, and initializes
.classfiles on demand, following the parent-delegation model. - Method Area: stores per-class metadata such as the run-time constant pool, field and method data, and bytecode.
- Heap: the region in which all objects and arrays are allocated.
- Java Stack: holds local variables and partial results. Each thread gets its own JVM stack, created when the thread starts.
- Program Counter (PC) Register: holds the address of the JVM instruction the thread is currently executing.
- Native Method Stack: supports the native (non-Java) methods used by the application.
- Execution Engine: executes the bytecode of the loaded classes. It contains the interpreter, the Just-In-Time (JIT) compiler, and the garbage collector.
- Native Interface (JNI): the bridge between Java code and native code at run time.
- Native Libraries: the platform libraries the native code depends on.
Run-Time Data Areas
The memory the JVM manages at run time is split into several regions, collectively called the run-time data areas. (A quick note on terminology: this is not the same thing as the Java Memory Model. The Java Memory Model is a separate specification that defines how threads observe one another’s writes through volatile, synchronized, and happens-before ordering; it has nothing to do with the heap layout described here.)
Some areas are shared by all threads, while others are private to a single thread:
- Shared: the Heap and the Method Area.
- Per-thread: the JVM Stack, the PC Register, and the Native Method Stack.
Understanding how the heap is laid out is essential to understanding garbage collection, so the rest of this section focuses on it.
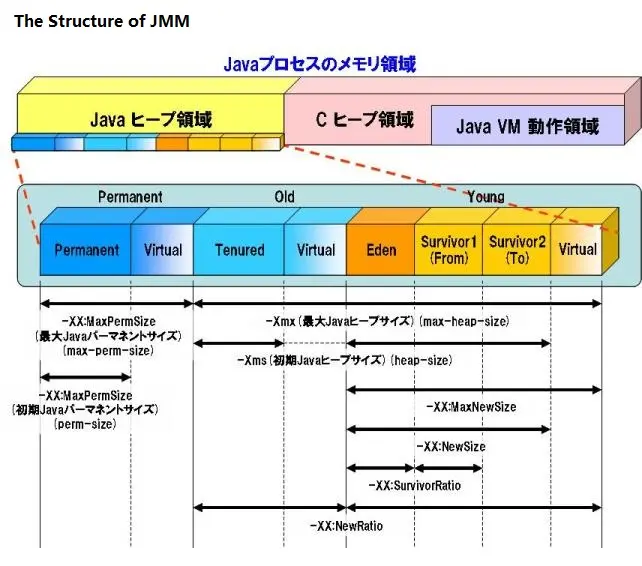
(Note that Metaspace sits in native memory, outside the heap; only the heap is sized by -Xms / -Xmx.)
The heap is divided into the Young Generation and the Old Generation. Class metadata used to live in a third region, the Permanent Generation, but as of Java 8 that has been replaced by Metaspace, described at the end of this section.
Young Generation
The Young Generation is where all new objects are created. It is split into one Eden space and two Survivor spaces (often called S0 and S1):
- Most newly created objects start out in Eden.
- When Eden fills up, a Minor GC runs: the surviving objects are copied into one of the survivor spaces, and Eden is cleared.
- Each Minor GC also copies the live objects out of the in-use survivor space into the other one, so at any moment one survivor space is always empty. (Why this copying back and forth? It is how the copying collector compacts memory and avoids fragmentation; more on that in the Garbage Collection section.)
- Objects that survive enough Minor GC cycles are promoted to the Old Generation. The age threshold is configurable via
-XX:MaxTenuringThreshold.
Old Generation
The Old Generation (also called the tenured generation) holds long-lived objects that have survived many Minor GCs. It is collected less frequently, by a Major GC, which generally takes longer than a Minor GC because it scans a larger, denser region. A Full GC collects the entire heap, both Young and Old generations.
Metaspace (replaces PermGen)
Before Java 8, class metadata (the description of classes and methods the JVM needs) lived in the Permanent Generation, a fixed-size region inside the heap. This was a frequent source of java.lang.OutOfMemoryError: PermGen space errors, because applications that loaded many classes, or that leaked class loaders, could exhaust it.
Java 8 removed PermGen (JEP 122) and replaced it with Metaspace. The key differences:
- Metaspace lives in native memory, not in the Java heap.
- By default it grows automatically as more classes are loaded, so it is no longer bounded by a fixed
-XX:MaxPermSize. You can still cap it with-XX:MaxMetaspaceSize. - The old tuning flags
-XX:PermSizeand-XX:MaxPermSizeno longer exist; passing them only prints a warning.
So when you read older JVM material that talks about “Perm Gen,” mentally translate it to Metaspace.
Garbage Collection
Garbage collection (GC) is the process of automatically finding objects the program can no longer use and reclaiming their memory. Unlike C or C++, where you allocate and free memory manually, the JVM does this for you, which removes a whole class of bugs (dangling pointers, double frees, and most memory leaks).
What counts as garbage?
A common simplification is that GC removes objects that are “not referenced anywhere.” The precise rule is reachability: the collector starts from a set of GC roots (local variables on each thread’s stack, active threads, static fields, JNI references) and marks every object reachable from them. Anything not reached is garbage, even if some other object still points to it.
That distinction matters. Two objects that reference only each other, but that nothing else points to, are unreachable and will be collected. A naive reference-counting scheme would never free them; this is exactly why the JVM uses tracing (reachability) collectors instead.
Why generations?
Most objects die young: a request handler creates a pile of short-lived objects and discards them almost immediately. This observation, the weak generational hypothesis, is why the heap is split into Young and Old generations.
The Young Generation is collected with a copying collector: live objects are copied out of Eden and the in-use survivor space into the empty survivor space, and everything left behind is reclaimed in a single step. Copying is cheap when most objects are already dead, because the collector only touches the survivors, and it naturally compacts memory. That is why there are two survivor spaces and why one is always empty. The objects that keep surviving are eventually promoted to the Old Generation, which is collected less often using mark-sweep and mark-compact style algorithms.
Stop-the-world
To move or free objects safely, the collector sometimes has to pause every application thread. This is a stop-the-world (STW) pause. Minor GCs are usually short, but a full collection of a large Old Generation can be noticeably long, and minimizing that pause is the main thing modern collectors compete on.
The HotSpot collectors
HotSpot ships several collectors, each striking a different balance between throughput (total work done) and latency (pause length). You select one with a JVM flag:
- Serial GC (
-XX:+UseSerialGC) is single-threaded and stop-the-world. It is simple and efficient for small heaps and for single-core or containerized environments. - Parallel GC (
-XX:+UseParallelGC) uses multiple threads to maximize throughput, and was the default through Java 8. - CMS (Concurrent Mark Sweep) was an older low-pause collector that did most of its work concurrently with the application. It was deprecated in Java 9 and removed in Java 14.
- G1 (Garbage-First) (
-XX:+UseG1GC) divides the heap into many small regions and collects the ones with the most garbage first, aiming for a configurable pause-time target. It has been the default since Java 9 and is a solid general-purpose choice. - ZGC (
-XX:+UseZGC) and Shenandoah (-XX:+UseShenandoahGC) are modern, mostly concurrent collectors built for very large heaps, with pause times in the sub-millisecond to low-millisecond range. Both became production-ready in Java 15.
For everyday applications you rarely need to choose manually; G1’s defaults are sensible. The time to reach for a different collector is when profiling shows that GC pauses (latency) or GC overhead (throughput) are actually hurting you.
Conclusion
The JVM is what gives Java its portability and its automatic memory management. We saw how it is organized into a class loader, run-time data areas, and an execution engine; how the heap is split into Young and Old generations, with Metaspace holding class metadata in native memory since Java 8; and how generational, reachability-based garbage collection reclaims memory, from the simple Serial collector up to G1, ZGC, and Shenandoah. To go deeper, the Oracle JVM Specification and HotSpot GC tuning guide below are the authoritative next step.
The Disqus comment system is loading ...
If the message does not appear, please check your Disqus configuration.