Similar Patient Finder
The ML-based app to find patients with similar gene expressions.
- Released
- Topics
- Python Tornado Machine Learning
Introduction
Similar Patient Finder (SPF) is a web-based clinical decision support tool that helps physicians explore patient similarities at the molecular level. Given a dataset of high-throughput gene expression profiles, optionally paired with clinical metadata, SPF runs a configurable analysis pipeline and renders the results as an interactive 2D patient map, making it easier to identify disease subtypes, staging, and appropriate therapy options.
The motivation was that raw genomic data is too high-dimensional for direct inspection. SPF bridges the gap between bioinformatics methods and clinical workflows by wrapping a full preprocessing-to-visualization pipeline in a browser-based interface that requires no command-line work from the physician.
Architecture
The backend is a Tornado application backed by MySQL (via SQLAlchemy). ML computations run on a ThreadPoolExecutor so the web server stays non-blocking while long-running analysis jobs execute in background threads. Processed results are serialized to JSON and streamed back to the browser, where D3.js renders the scatter plots.
Each user manages their own set of projects. A project stores the uploaded dataset files and a project-config.json that records the last-used dataset and metaset filenames, so the workbench can restore state across sessions.
Analysis Pipeline
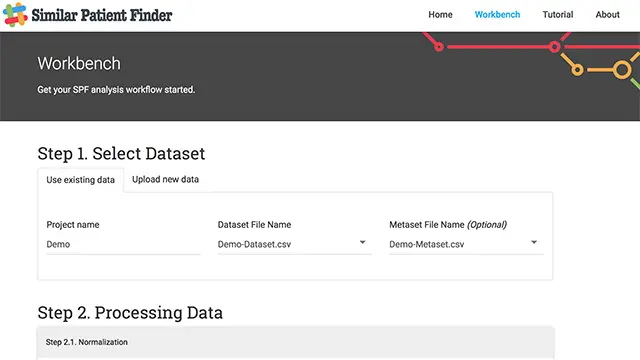
The core of SPF is a composable algorithm pipeline. The user assembles a sequence of steps in the workbench; the server chains them in order and always appends a t-SNE step at the end to reduce the data to two dimensions for visualization.
Preprocessing (optional, applied first):
| Step | Methods |
|---|---|
| Missing value imputation | Mean / median / most-frequent |
| Normalization | Z-score, zero-centered, min-max, max-abs, median-centered (Robust Scaler) |
Dimensionality reduction (optional):
| Method | Notes |
|---|---|
| PCA | Configurable number of components |
| Random Projection | Sparse random projection |
| Feature Selection | SelectKBest (χ² or F-score) |
| MDS | Multi-dimensional scaling |
Classification / Clustering (optional):
| Algorithm | Key parameters |
|---|---|
| K-Nearest Neighbors | k, distance metric, weighting |
| SVM | Kernel (RBF / linear / poly), C, γ |
| Random Forest | Number of trees, split criterion |
| K-Means | Number of clusters; also returns nearest-neighbor graph |
| Hierarchical Clustering | Linkage method; returns a collapsible dendrogram |
After the pipeline runs, t-SNE projects the (now lower-dimensional) data to 2D coordinates. The browser renders each patient as a dot on the scatter plot, colored by label, with cluster centers, nearest-neighbor edges, or the dendrogram overlaid depending on which algorithm was chosen.
Screenshots



The Disqus comment system is loading ...
If the message does not appear, please check your Disqus configuration.